I hope you have read my previous article about web analytics and web monitoring with Google Analytics . Because, in that article you will find analytics jargon, concept, like metrics and dimension and so on.
Once you know the basic of Google analytics, I am sure you know how to use Google analytics. It will be easier for you to practice in Google analytics dashboard if you have basic understanding of web analytics with Google.
In this article, I will show you sample Google analytics report. I will display step by step to develop Google analytics custom reports.
I explain you two examples of Google analytics custom report here. They are:
- Monitor the good landing page and bad landing page.
- Get information what is the sources (referral) of your landing page traffic.
- Good landing page is recognized by bounce rate. The lesser bounce rate the better the landing page.
- Good landing page can deliver you visitor to another page or can encourage your visitor to make an action, for example: click register, click buy button, browse more page, etc.
- From one session, how many new users are there.
- Bounce rate of certain landing page.
- Page per sessions of individual landing page.
So, from this custom report example, you can get information, such as: how impressive your copywriting or your content, how effective your landing page encouraging your visitor to browse more page or make an other action, how many new users visit your landing page, and so on.
You can see in the picture above. I think it is very clear and you can follow the step by your own after login Google Analytics and go to the dashboard.
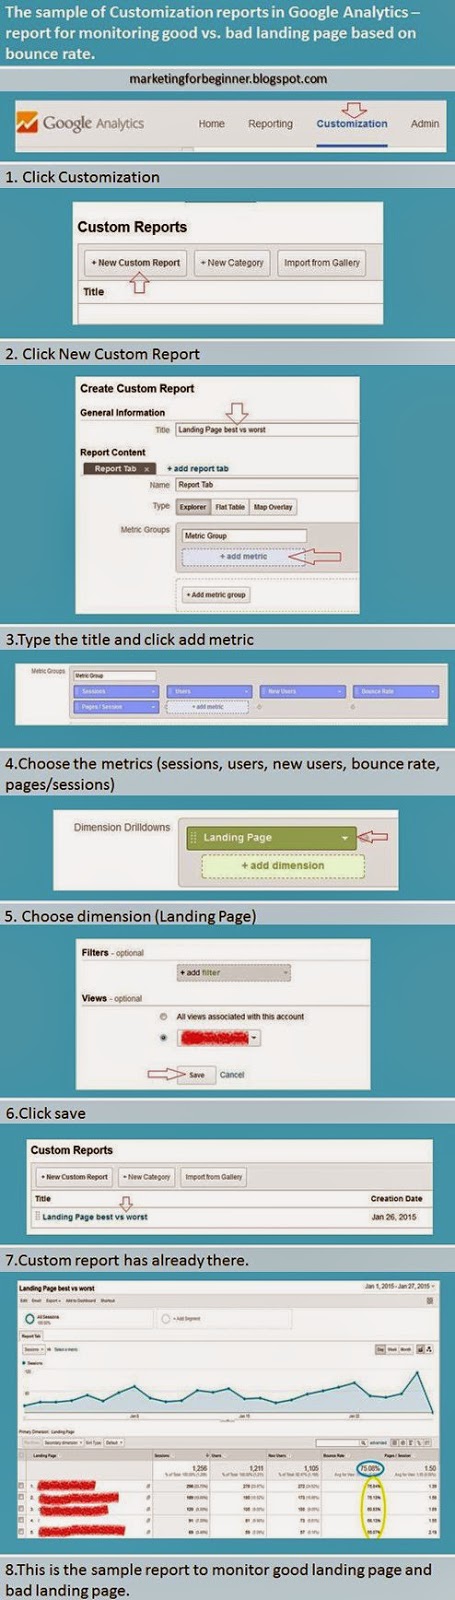
1. Click Customization
2. Click New Custom Report
3. Type the title, for example: Landing page best vs. worst
4. Click add metric
5. Choose the metrics from the table = sessions, users, new users, bounce rate, pages/sessions
6. Choose dimension = landing page
7. Click save.
8. Once you clicked save, now the custom report has been already there.
9. Click the title, and you will see the report.
- There are many sessions, and for particular landing page there are new users. It means your campaign/SEO are done well, because from a session, most of them are the new users not the previous users.
- You have less bounce rate (average 75%). It means your landing page quite good to drive users browsing another page.
- Pages/sessions is 1.50. It is not bad, but you have to make some improvement if your website goal is to deliver content (content marketing) and the goal is encourage your visitor to browse more page in your web. So that you can achieve more with some improvements. For examples: make your navigation clear, modify the template, make a clear call-to-action to browse more, etc.
Summary: improve the content especially browsing navigation and clear call-to-action for browse more.

As you see in the picture, the step is the same as before.
- To know which sources drive visitors to your landing page.
- To see how effective your SEO strategy for organic search.
- To see the result of your social media campaign.
Most of the step is the same, except choosing the metrics, dimensions, and display type.
For metrics : sessions.
For dimensions: landing page, source, traffic type.
For display type: choose Flat Table.
- Most of the traffic is come from organic search Google, there are several come from Bing and Yahoo also.
- The second traffic generation is from particular social media (Facebook), so Twitter and Pinterest do not work here.
Summary: focus on SEO effort and be more active on Facebook.
OK, I hope you understand and have practicing with another scenario, another goal, another display, and another custom reports.
Update: You can read many resources all about Google Analytics - ultimate Guide Google Analytics 2015 here.
Once you know the basic of Google analytics, I am sure you know how to use Google analytics. It will be easier for you to practice in Google analytics dashboard if you have basic understanding of web analytics with Google.
In this article, I will show you sample Google analytics report. I will display step by step to develop Google analytics custom reports.
I explain you two examples of Google analytics custom report here. They are:
- Monitor the good landing page and bad landing page.
- Get information what is the sources (referral) of your landing page traffic.
Custom report for analyzing landing page
Before practice making a custom report, I will explain you the some foundations.- Good landing page is recognized by bounce rate. The lesser bounce rate the better the landing page.
- Good landing page can deliver you visitor to another page or can encourage your visitor to make an action, for example: click register, click buy button, browse more page, etc.
The goal of this sample custom report:
- To see how many sessions of the particular landing page.- From one session, how many new users are there.
- Bounce rate of certain landing page.
- Page per sessions of individual landing page.
So, from this custom report example, you can get information, such as: how impressive your copywriting or your content, how effective your landing page encouraging your visitor to browse more page or make an other action, how many new users visit your landing page, and so on.
The steps of creating custom report for analyzing landing page
You can see in the picture above. I think it is very clear and you can follow the step by your own after login Google Analytics and go to the dashboard.
1. Click Customization
2. Click New Custom Report
3. Type the title, for example: Landing page best vs. worst
4. Click add metric
5. Choose the metrics from the table = sessions, users, new users, bounce rate, pages/sessions
6. Choose dimension = landing page
7. Click save.
8. Once you clicked save, now the custom report has been already there.
9. Click the title, and you will see the report.
Information you can get from this custom report
- There are many sessions, and for particular landing page there are new users. It means your campaign/SEO are done well, because from a session, most of them are the new users not the previous users.
- You have less bounce rate (average 75%). It means your landing page quite good to drive users browsing another page.
- Pages/sessions is 1.50. It is not bad, but you have to make some improvement if your website goal is to deliver content (content marketing) and the goal is encourage your visitor to browse more page in your web. So that you can achieve more with some improvements. For examples: make your navigation clear, modify the template, make a clear call-to-action to browse more, etc.
Summary: improve the content especially browsing navigation and clear call-to-action for browse more.
Custom report for analyzing source of landing page
As you see in the picture, the step is the same as before.
Goal of creating this report
- To know which sources drive visitors to your landing page.
- To see how effective your SEO strategy for organic search.
- To see the result of your social media campaign.
The steps of creating custom report for analyzing source of landing page
Most of the step is the same, except choosing the metrics, dimensions, and display type.
For metrics : sessions.
For dimensions: landing page, source, traffic type.
For display type: choose Flat Table.
Information that is gained from the custom report
- Most of the traffic is come from organic search Google, there are several come from Bing and Yahoo also.
- The second traffic generation is from particular social media (Facebook), so Twitter and Pinterest do not work here.
Summary: focus on SEO effort and be more active on Facebook.
OK, I hope you understand and have practicing with another scenario, another goal, another display, and another custom reports.
Update: You can read many resources all about Google Analytics - ultimate Guide Google Analytics 2015 here.


0 comments:
Post a Comment